Linear Regression Calculator
A regression equation is the straight line ŷ = a + bx that best fits a set of x, y data by the least-squares method. The slope is b = Sxy ÷ Sxx and the intercept is a = ȳ − b·x̄. For the sample data below (temperature vs. iced coffees sold), the regression line is ŷ = −28.2 + 1.14x, with r ≈ 0.992.
Paste or type your data to get the regression equation, the correlation coefficient r, r², the standard error, a prediction for any x, and a scatter plot with the fitted line.
How to use the Linear Regression Calculator
- Choose how to enter the data: x, y pairs (one pair per line) or Two lists (all the x values in one box and all the y values in the other).
- Type or paste your data. Separate x and y with a comma, a space, a tab or a semicolon. To copy from Excel or Google Sheets, select the two columns and paste them. If the first row holds column names, it is skipped and the names label the chart.
- Optional: enter an x value in Predict y at x to get the predicted ŷ.
- Press Calculate. You get the regression equation, the slope and intercept, r, r², the standard error of the estimate, the standard errors of the slope and intercept, and a scatter plot with the fitted line. Open Show the calculation steps to see every sum.
If a line can't be read, the calculator tells you its line number so you can fix it. It accepts up to 5,000 points.
Regression equation formula
The least-squares regression line, also called the line of best fit, is the straight line that makes the sum of the squared vertical distances from the points to the line as small as possible.
| Symbol | Meaning |
|---|---|
| ŷ | Predicted y for a given x |
| b | Slope: change in ŷ for each 1-unit increase in x |
| a | y-intercept: the value of ŷ when x = 0 |
| x̄, ȳ | Means of the x and y values |
| n | Number of data points |
| r | Pearson correlation coefficient, from −1 to 1 |
| s | Standard error of the estimate (residual standard error) |
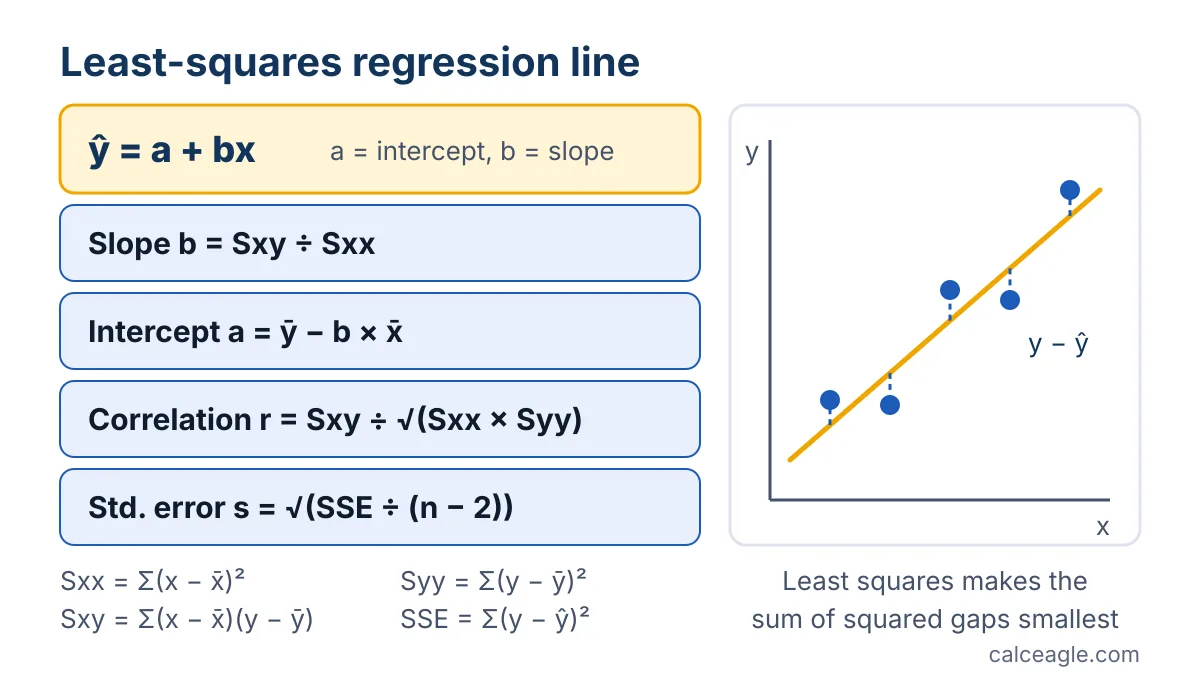
Because a = ȳ − b·x̄, the line always passes through the point (x̄, ȳ). The standard error divides by n − 2 rather than n because two quantities, the slope and the intercept, were estimated from the same data.
Example: temperature and iced coffee sales
A coffee cart owner notes the daily high temperature and the number of iced coffees sold on five days (illustrative numbers):
| Day | High temperature, x (°F) | Iced coffees sold, y |
|---|---|---|
| 1 | 70 | 52 |
| 2 | 75 | 58 |
| 3 | 80 | 61 |
| 4 | 85 | 69 |
| 5 | 90 | 75 |
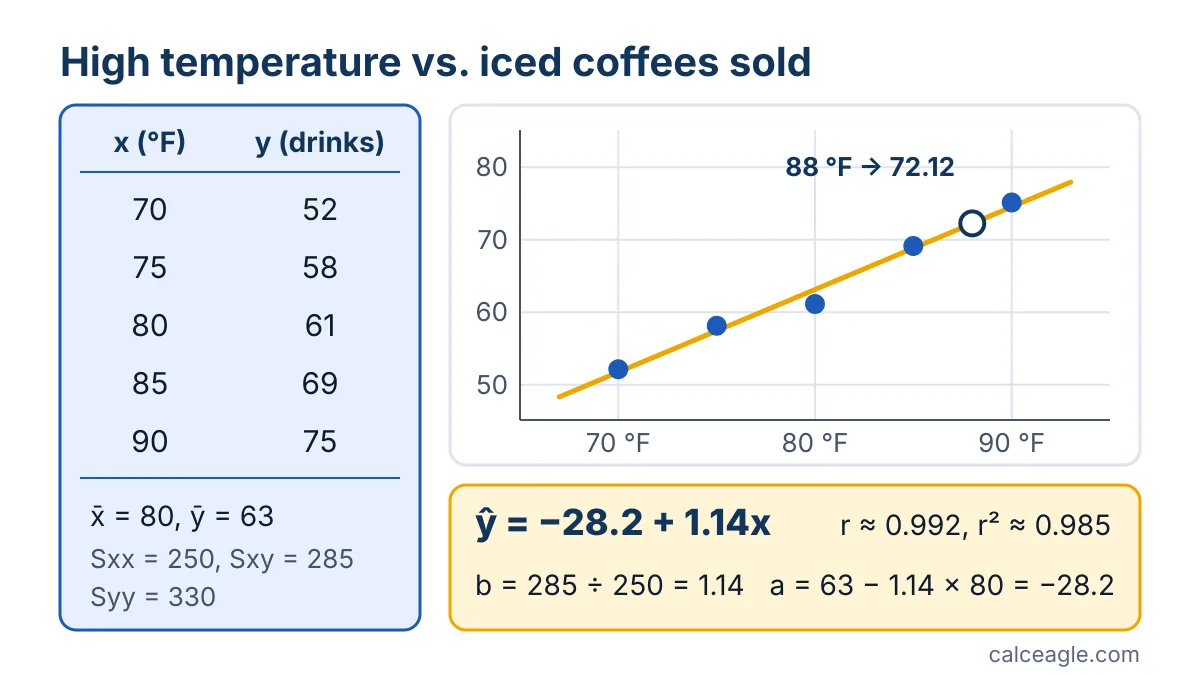
- Means. x̄ = 400 ÷ 5 = 80 and ȳ = 315 ÷ 5 = 63.
- Deviations. x − x̄ = −10, −5, 0, 5, 10 and y − ȳ = −11, −5, −2, 6, 12.
- Sums. Sxx = 100 + 25 + 0 + 25 + 100 = 250. Sxy = 110 + 25 + 0 + 30 + 120 = 285. Syy = 121 + 25 + 4 + 36 + 144 = 330.
- Slope and intercept. b = 285 ÷ 250 = 1.14 and a = 63 − 1.14 × 80 = −28.2.
- Regression equation: ŷ = −28.2 + 1.14x.
- Correlation. r = 285 ÷ √(250 × 330) = 285 ÷ 287.228 ≈ 0.9922, so r² ≈ 0.9845.
- Standard error. SSE = Syy − b·Sxy = 330 − 1.14 × 285 = 5.1, so s = √(5.1 ÷ 3) ≈ 1.304 drinks.
- Prediction. Tomorrow's forecast high is 88°F: ŷ = −28.2 + 1.14 × 88 = 72.12, or about 72 iced coffees.
These are the sample values already loaded in the calculator, so you can press Calculate and compare.
How to read the result
- Slope (b): each 1°F increase goes with about 1.14 more iced coffees sold.
- Intercept (a): the predicted y when x = 0. It is often not meaningful on its own. Selling −28.2 drinks at 0°F is impossible, a reminder that the line only describes the range you measured, 70°F to 90°F.
- r: always between −1 and 1, with the same sign as the slope. Values near −1 or 1 mean the points lie close to a straight line; values near 0 mean no linear pattern.
- r²: the share of the variation in y that the line accounts for. Here r² ≈ 0.98, so about 98% of the day-to-day variation in sales lines up with temperature.
- Standard error of the estimate (s): the typical distance of a point from the line, in y units. Predictions here are typically off by about 1.3 drinks.
- Standard errors of the slope and intercept: how precisely b and a are estimated. They are used for confidence intervals and t-tests.
Assumptions and limitations
- Straight lines only. A strongly curved pattern can still give r near 0. Always look at the scatter plot. If the data shrink by a steady percentage over time, an exponential model such as the one in the Exponential Decay Calculator may fit better.
- Outliers matter. Least squares is very sensitive to unusual points; one or two can noticeably tilt the line.
- Extrapolation is risky. Predictions for x values outside your data can be unreliable, so the calculator flags them.
- Correlation is not causation. A strong r shows that two variables move together, not that one causes the other.
- y on x. The line minimizes vertical distances. Swapping x and y gives a different line unless r = 1 or −1.
- Special cases. You need at least 2 points. With exactly 2 the line passes through both, r = ±1, and the standard error can't be estimated. If every x is the same, the line would be vertical and the slope is undefined. If every y is the same, the slope is 0 and r is undefined.
- Accuracy. The calculator was checked against the National Institute of Standards and Technology's certified results for its Norris test dataset and matches the slope, intercept, residual standard deviation and R-squared to at least 12 significant digits.
Common mistakes
- Swapping the variables. Put the variable you use to predict (explanatory) in x and the one you want to predict (response) in y.
- Mismatched lists. In two-list mode, the nth x must belong with the nth y. Lists of different lengths are rejected.
- Quoting r as a percentage. "r = 0.70" does not mean 70% is explained; r² = 0.49 means 49%.
- Thousands separators in comma-separated pairs. Write 1250, 3400, or separate the pair with a space or tab (1,250 3,400).
- Trusting a tiny sample. Five points, as in the example, can show a pattern but say little about how reliable it is.
Frequently asked questions
Is a regression line the same as a regression equation?
Yes. The regression equation, ŷ = a + bx, is the formula for the regression line (the line of best fit). The calculator gives the equation and draws the line on a scatter plot.
How do I find the regression equation in Excel?
Use =SLOPE(known_y's, known_x's) for b and =INTERCEPT(known_y's, known_x's) for a. Note that the y range comes first. You can also paste the two columns straight into this calculator.
What is a good r-squared value?
There is no single cutoff; what counts as good depends on your field and on what you need the line for. A high r² only says the points sit close to a straight line, so also check the scatter plot for curves and outliers, and look at the standard error to see how far off predictions typically are.
Can I predict values outside my data range?
You can, but with caution. The line describes only the range of x you measured, and the relationship may change beyond it. The calculator warns you when a prediction is an extrapolation.
Why is the y-intercept negative or meaningless?
The intercept is the predicted y at x = 0, which may be far outside your data. In the example, −28.2 drinks at 0°F is impossible; it just positions the line so it fits the 70°F to 90°F data.
Sources and references
- 4.1.4.1. Linear Least Squares Regression (NIST/SEMATECH e-Handbook of Statistical Methods) — National Institute of Standards and Technology
- StRD Linear Regression Dataset Norris: Certified Values — National Institute of Standards and Technology
- 12.3 The Regression Equation (Introductory Statistics 2e) — OpenStax, Rice University
- 1.4 - What is The Common Error Variance? (STAT 501) — Penn State Eberly College of Science
- SLOPE function — Microsoft Support
Formulas and content last reviewed on October 13, 2026. Last updated October 13, 2026. Results are estimates for general information only. Spotted a problem? Tell us and we will check it.